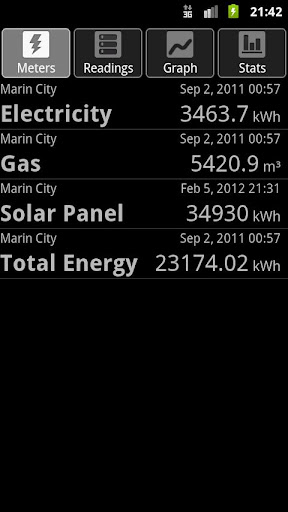
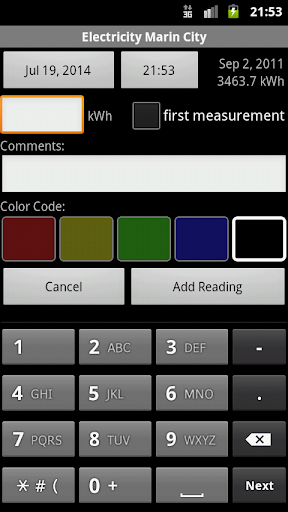
This application keeps track of your energy consumption. Add your meters for gas, electricity, or water to the database and record the current meter readings from time to time. Readings can be color-coded and comments may be added to remember special situations which may explain unusual energy usage. A regular reading interval is not required, take a reading whenever it is convenient.
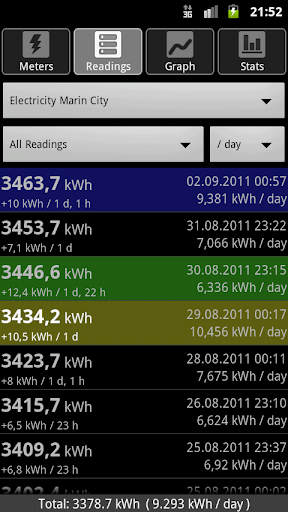
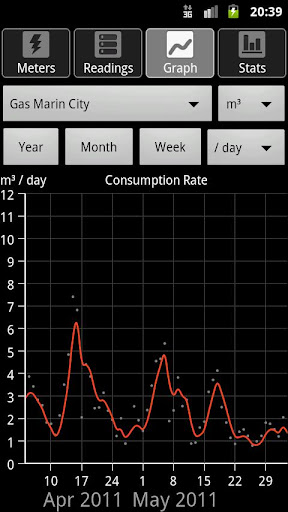
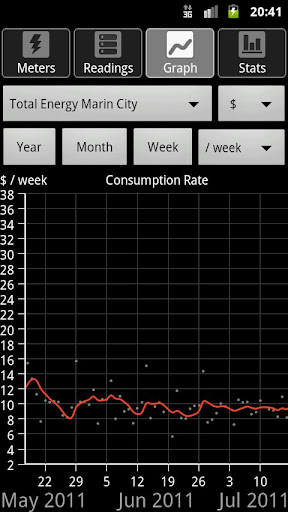
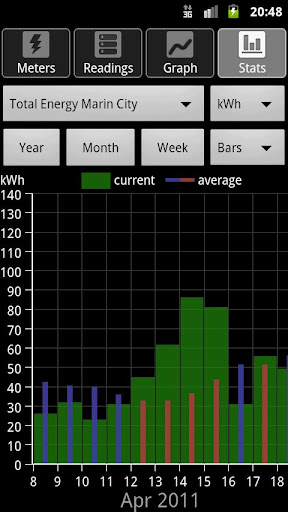
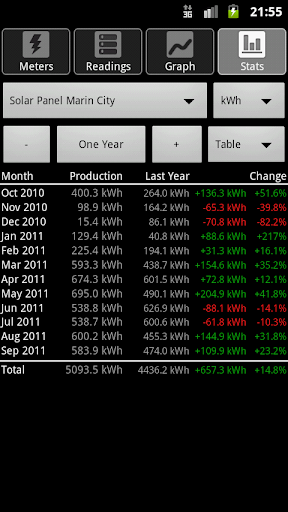
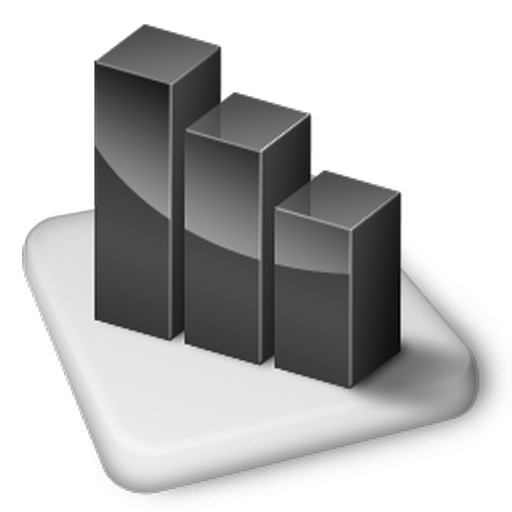
From the entered data, the application calculates the average normalized rate of consumption per hour, day, week, or month (bewteen two readings) and draws a graph showing the consumption rate over time. The total amount of actually used energy during each day, week, month, or quarter is displayed as a bar graph or table. If the average cost per unit is provided, the graphs can also show the amount of money instead of energy.
For CLOUD SYNC: Please install a suitable auto-sync app for your favorite cloud service and set it up to sync the contents of the ECAS data folder. Since there are so many cloud services to choose from and ready-made auto-sync apps are available for free, ECAS does not duplicate this functionality. This also means that ECAS does not need any network access rights.
Meter exchange or reset is detected automatically and consumption data is recorded seamlessly across the reset.
Pinch zoom can be used on the trend and bar graph pages. In landscape orientation, comments are displayed in the list view.
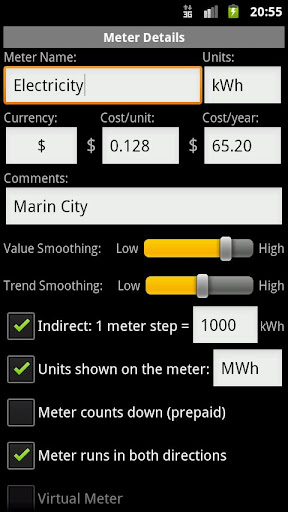
Indirect metering is supoorted. In this case, the meter value is multiplied with a certain factor to convert it to the final energy value. Two separate unit texts can be entered, one for the meter and one for the actual energy value.
Meters can be marked to count backwards, which can happen with prepaid meters, showing the amount of remaining prepaid energy instead of used energy.
Virtual meters can be used to display the sum of individual meters and do simple unit conversion, for example from m3 to kWh. Please note that you should read your physical meters which are part of a virtual meter all around the same time for best results.
Meter data can be imported from and exported to CSV files from the context menu of each meter (long-press on the meter entry). Meters can also be edited and deleted via this context menu.
In addition to meter readings, sensor data like temperature or wind speed can be recorded. At the moment, this data is shown separately, but may be shown in combination with meter data in future releases.
ECAS is currently available in the following languages:
English, German, Japanese: Maintained by developer.
Czech: Provided by ONovy
Danish: Provided by Kim
Dutch: Provided by Gerard
French: Provided by Bernard
Hungarian: Provided by Peter
Italian: Provided by SDS
Polish: Provided by Sławomir Soch
Romanian: Provided by Lucian
Russian: Provided by Nikolai
Slovak: Provided by Silvio
Slovenian: Provided by Tomi
Spanish: Provided by Javier
Swedish: Provided by Lars
Turkish: Provided by Suphi
Want to run ECAS in your own language? Visit the ECAS website and check out the translation page!
IMPORTANT NOTE: The trend graph does NOT show total amount of energy used. The bar graph is used for this information. The trend graph shows usage values normalized to a certain time period (hour/day/week/month or year). If your meter records a usage of 10kWh within one hour (10kW power), the trend will show a usage rate of 240kWh per day for that measurement point (10kWh/h = 10kW power rating, normalized to one day -> 10kW * 24h = 240kWh). This is by design.
In case of questions or bug reports, please check the website (FAQ section) or send me an email.
免費玩Energy Consumption Analyzer APP玩免費
免費玩Energy Consumption Analyzer App
Energy Consumption Analyzer APP LOGO
Energy Consumption Analyzer APP QRCode
| 熱門國家 | 系統支援 | 版本 | 費用 | APP評分 | 上架日期 | 更新日期 |
|---|---|---|---|---|---|---|
| 未知 | Android Google Play | 2.4.5 App下載 | 免費 | 1970-01-01 | 2015-04-21 |