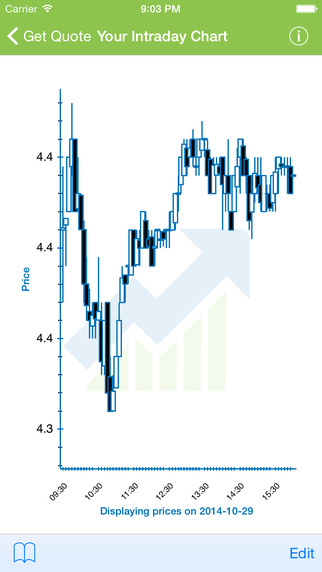
Every successful trader knows the importance of historical chart patterns... In fact, one thing that never seems to change is that history repeats itself, and every stock has historical and emotional patterns. Yet... When you look at daily / intraday charts, often from stocks that will react the same way as the they would of in the past, you have not been able to view any past intraday history for a stock on that day. Well... That is until now. With StrikePrice Intraday Charts(TM) you can easily view the last few days daily intraday chart for a stock. In fact... You can view any specific intraday chart of a stock for the last three years! How did this same stock begin the day yesterday? Did it initially spike and then drop? Was the spread between the bid and the ask smaller? What was yesterday's Volume at the time of day compared to today's? How did this stock fair the last time it spiked? Did it continue for days? If you ever day intraday, then you know the importance of intraday charts. Now you can finally take advantage of specific intraday patterns and statistics.
| 熱門國家 | 系統支援 | 版本 | 費用 | APP評分 | 上架日期 | 更新日期 |
|---|---|---|---|---|---|---|
| 未知 | iOS App Store | 1.0 App下載 | 免費 | 2015-05-18 | 2015-06-03 |


